3D workflow
Esmraldi is suited for the joint statistical analysis of 3D MS images along with other imaging modalities. The registration and statistical analysis steps should be adapted compared to the traditional 2D use-case. Refer to Usage for this case.
Registration
Usually, 2D MS slices have different intensities. Thus, regular intensity-based metrics are not suited. We opt for metrics based on the geometry of the objects. The distance transformation maps each pixel to its distance to the border of the object. It is applied prior to the registration step on both the reference and target images.
Moreover, the orientations of the samples are usually very different for several 2D MS slices. As a result, it is difficult to choose appropriate registration parameters suited for the registration of all slices. We opt for an exhaustive registration approach, where the global optimum is selected over predefined rotation and scaling parameters.
It can be applied in the code directly by calling:
python -m examples.registration --best_rotation -i INPUT -o OUTPUT
Followed by the variational registration step based on the distance transformed images.
Statistical analysis
Statistical analysis can be done on the full 3D volume, or on each 2D slice independently. In cases of varying intensities between 2D MS slices, the latter approach should be preferred, by specifying this argument:
python -m examples.statistical_analysis --split
Registration is done from the shape of the objects. After registration, the borders of both objects should be aligned. However, regions which are similar in terms of intensity might not be perfectly aligned. We propose to use the output from the NMF (Non Negative Matrix Factorization). The register component images are registered by translation onto the reference image. The translation is activated by default during statistical analysis. If you would like to deactivate NMF component image translation, you can use the following argument:
python -m examples.statistical_analysis --no_translation
Visualization
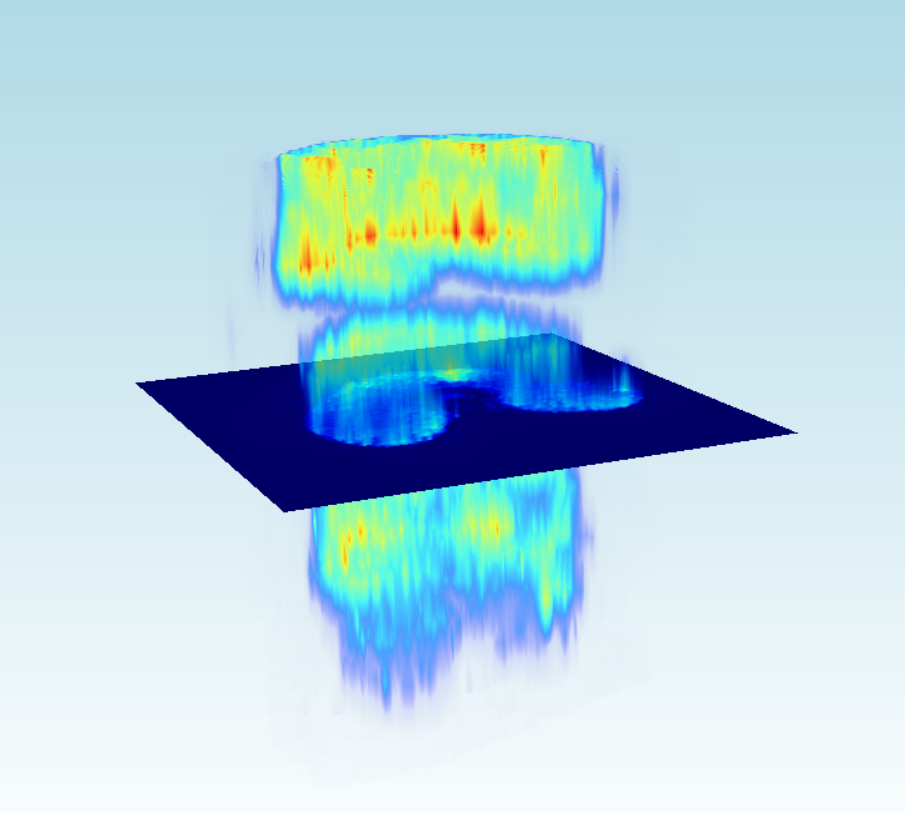
At each step of the workflow, 3D MS images may be visualized. Our visualization tool allows for the visualization of 2D slices, as well as a rendering of the volume.
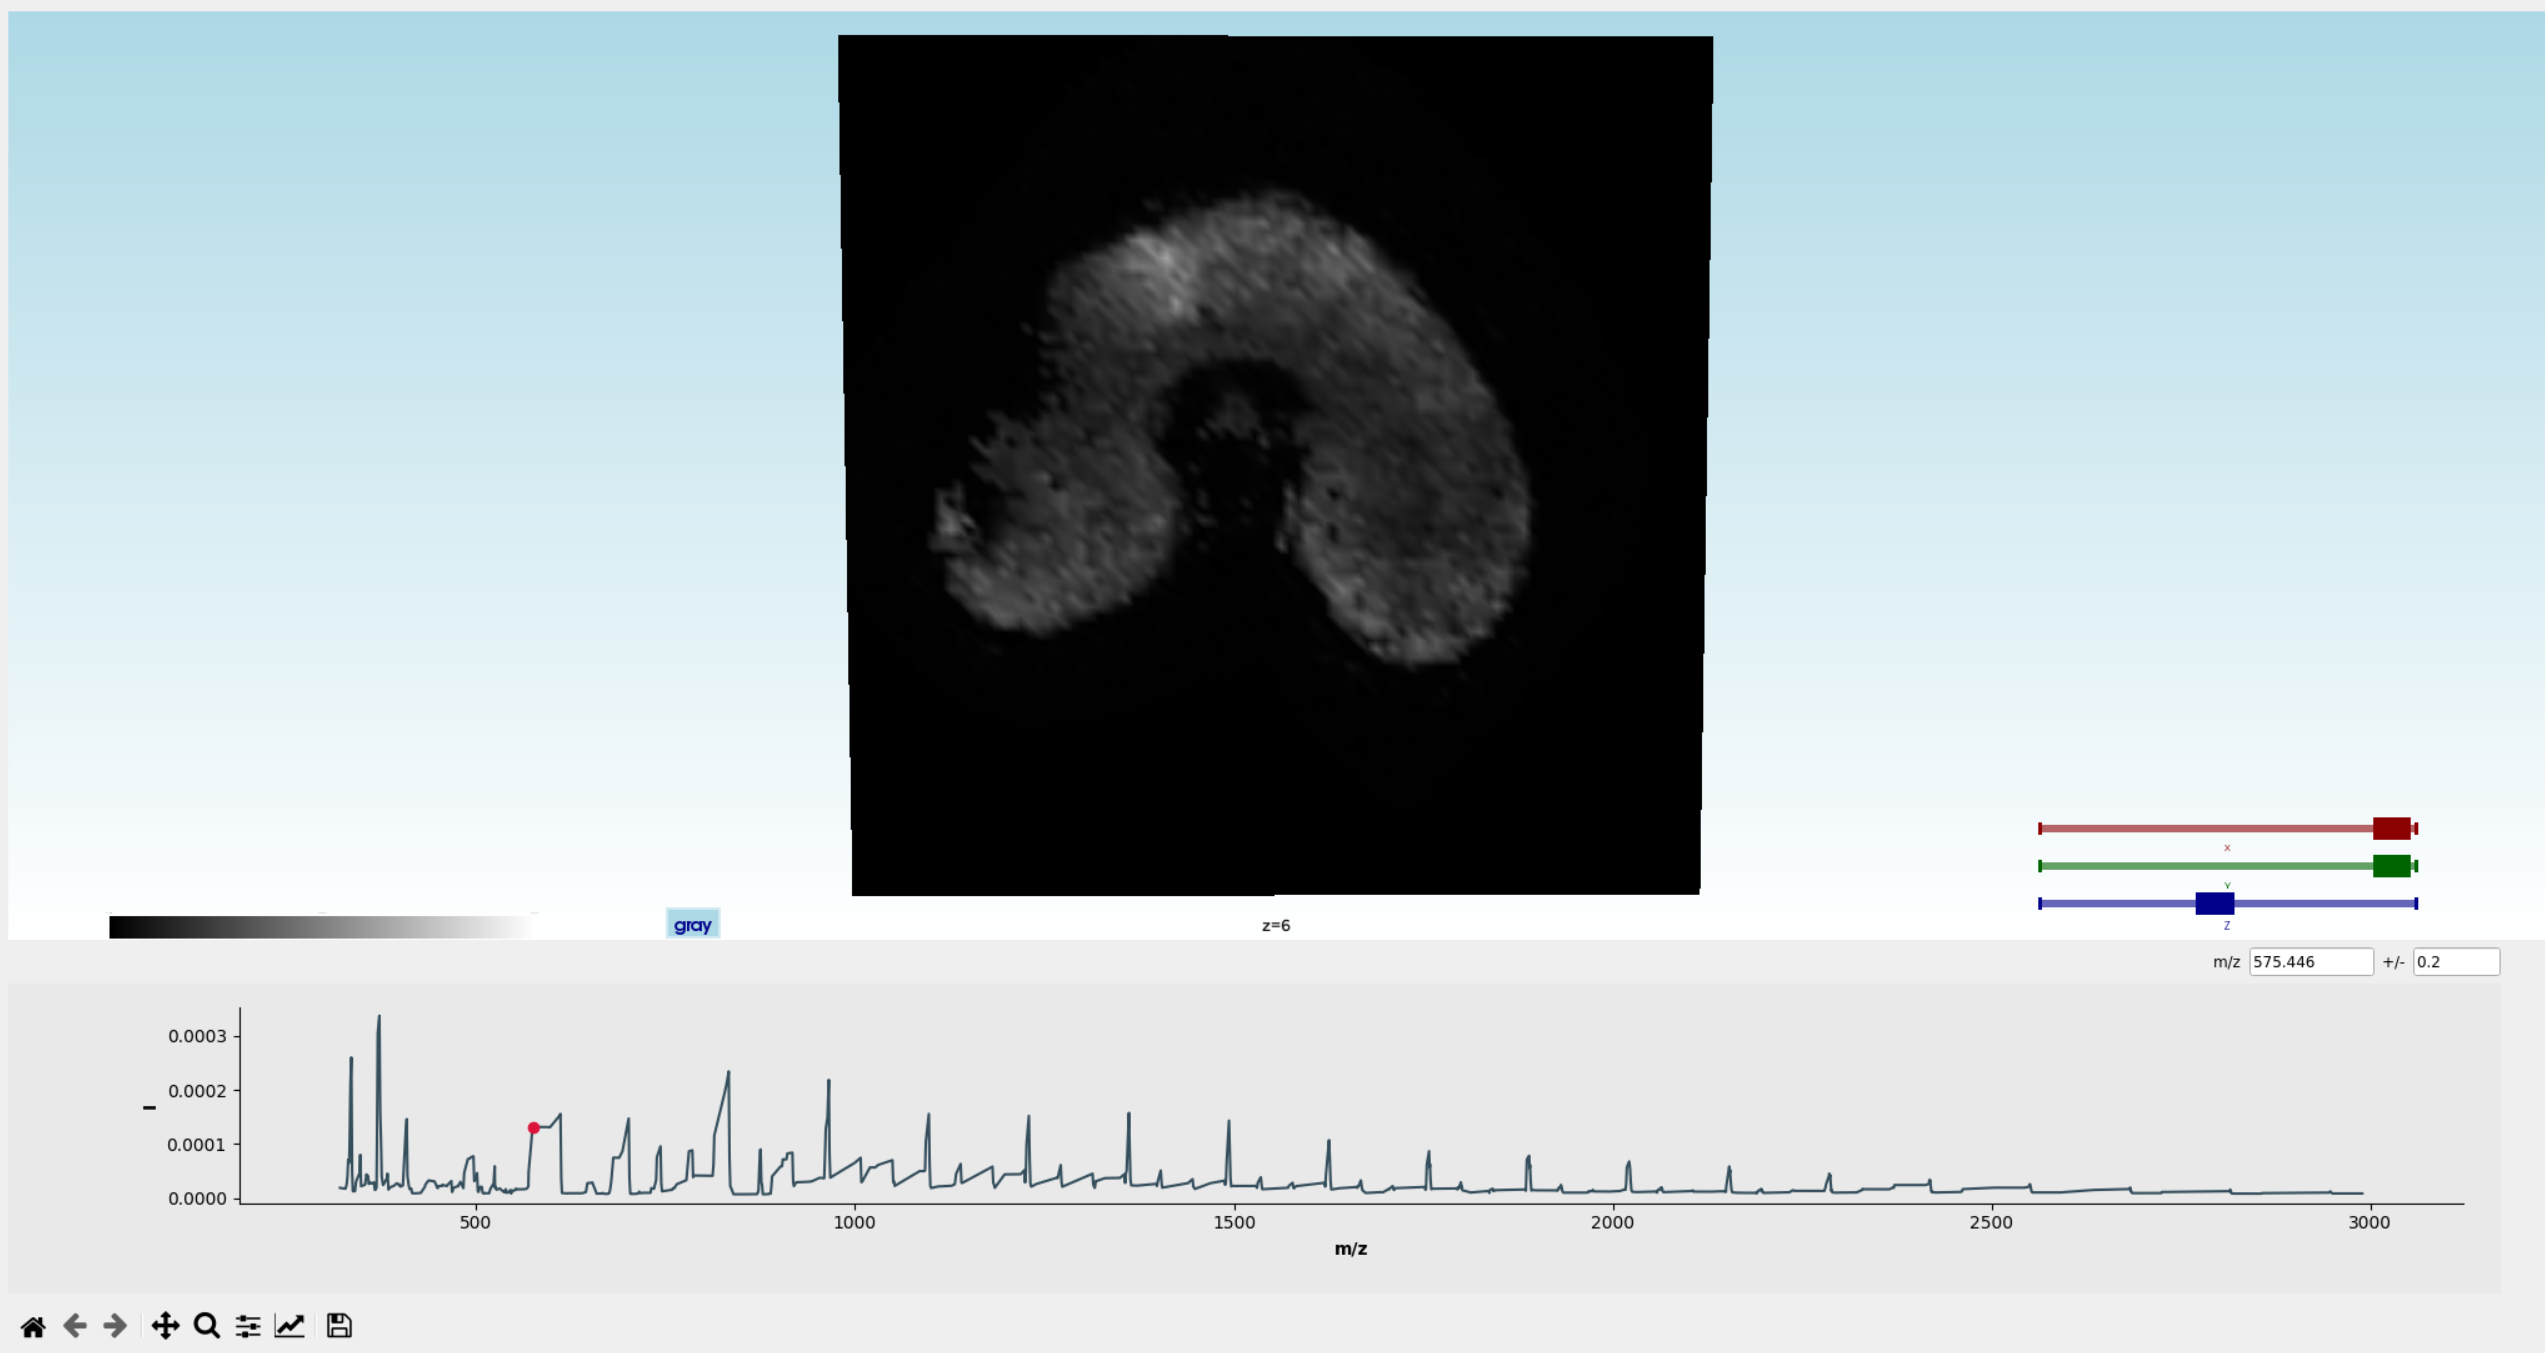
The slices can be selected by the slider “z” on the right of the screen. One can select specific m/z, using the text box on the right of the screen, or by clicking on the average spectrum displayed below the image. All 2D slices can be shown at the same by hitting the “z” key. The 3D volume rendering can be shown by hitting the “v” key:
The visualization tool can be launched using:
python3 -m examples.3D_viewer -i INPUT -s SPACING_SLICES --memmap
The spacing argument allows to set the distance between each 2D MS slices. It is expressed as the multiplicative ratio between the lateral resolution and spatial resolution. For instance, for a pixel size of 20x20, with an inter-slice parameter of 100, the spacing would be 100/20 = 5.
The memmap argument allows to map the file to disk, which allows for faster loading of the image in the subsequent usages. Warning: this option copies the image on the disk in a folder called “mmap”. This might result in large disk usage.